TILLINGHAST WAVEFRONT SENSOR (TWFS)
Created 02/03/08 by EF
Updated 11/09/15 by EF
Deb Woods designed and built a Shack-Hartmann wavefront sensor for the
1.2m telescope at FLWO. A description of its operation is
here (PDF).
Deb modified the WFS in 2007 for the Tillinghast 1.5m.
Assembly instructions with multiple views appear
here.
We first used TWFS on 16 October 2007. We obtained marginal data,
as shown by this image:
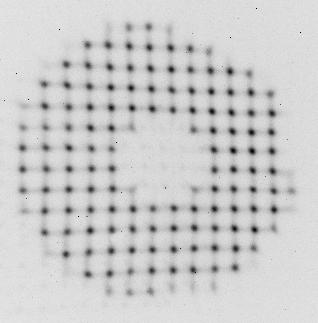
Images such as this one showed that
the telescope covers occluded the light path (right and bottom right).
We struggled analyzing such data with the MMT wavefront sensor analysis
software of Tom Pickering et al. (SPIE 2004, 5489, 1041) which TP adapted to
our purposes. We then decided to acquire the Sensoft software
package from Spot-Optics, which is appropriate for our data.
We purchased the package in June 2008. We analyzed the data above
for practice with Sensoft, and obtained the results shown
here (PDF). Because of the problems seen in the image above, we
did not trust the results to change the collimation of the telescope.
We planned to run TWFS again and use the new data to refine
the collimation of the telescope.
We mounted TWFS on 27 January 2009. The procedure is non-trivial, because
the FAST (or other instrument) must first be removed,
TWFS mounted, and FAST must be replaced when finished with TWFS.
E. Falco and W. Peters tried to run TWFS. We followed the procedures
described here. With help over the phone from
Deb Woods, we were able to acquire data. Unfortunately, we had strong
winds from the North, which led to some of the worst seeing in our
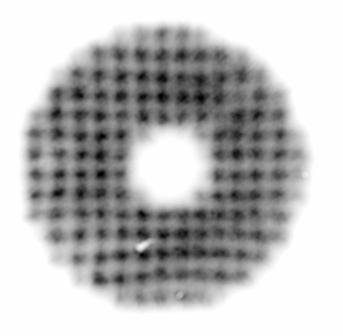
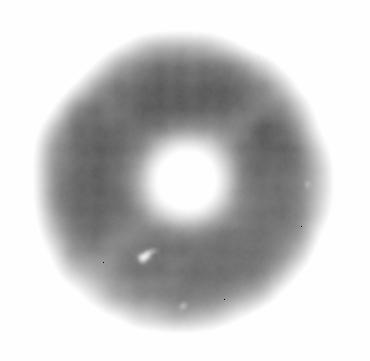
memory (over 10 arcsec FWHM). The next 2 images show some of the
results, going from bad (left) to totally useless (right):
We have now tried several times, and have obtained good quality data.
The latest were on June 16 and 17.
With these data and using new software
that Deb wrote with John Roll, as well as with Sensoft, we were able to
derive a prescription in terms of the number of turns of the collimation
bolts that would reduce the measured aberrations.
The next image shows the best of the lot from June 17, after applying the
calculated corrections to the bolts:
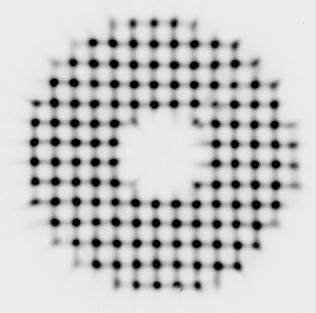
See the prescription for this image as calculated with Sensoft
here (pdf)
See a description of the calculation of bolt turns
for Sensoft prescriptions here (pdf).
The following are the aberrations that Deb measured with her
software wfs, in nm:
Number  Term    z               Aberration
------  ----    ------------    -------------------------------
     2   1 1     5788.47        x-tilt
     3   1 1    13129.8         y-tilt
     4   0 2       -0.764777    defocus
     5   2 2     -350.584       astigmatism +/- 45 deg axis
     6   2 2      108.767       astigmatism at 0 or 90 deg
     7   1 3      -30.7008      coma along y-axis
     8   1 3      -10.9223      coma along x-axis
     9   3 3       36.352       trefoil along y-axis
    10   3 3      -35.9293      trefoil along x-axis
    11   0 4        1.26993     spherical
    12   2 4      -28.0668      secondary astigmatism at 0 deg
    13   2 4        8.9826      secondary astigmatism at 45 deg
These (ignoring the tilts) are all significant improvements over where
we started. We will monitor the collimation periodically.
Procedure once TWFS is mounted:

0) Run vncviewer nflwo60:1 as observer, cd ./woods.
1) Connect guide camera BNC to guide monitor.
2) Connect internet to camera (other end in chart room).
3) Turn Apogee CCD camera on and begin cooling.
4) Start the WFS GUI: type ./startapogee in ./woods.
5) Pop the temp plots, use ALT-P (or Edit and Properties).
6) Take bias frames.
7) Plug in power to LED, push knob in.
8) Take reference images with the LED (2 sec).
9) Unplug power to LED, pull knob out.
10) Change 1.5m focus to FAST value +50 (about).
11) Point teliescope to bright star and center star on video screen.
12) Take test image to check integration time (about 10 sec for
    V=5 mag star) and focus.
13) If desired, pop the calibrations window, use ALT-C.

States:
. Knob out: sky, turn off LED (unplug).
. Knob in: LED, turn on LED.
. Bias levels should be about 2700.
. Temp set point -30C.
. TWFS guider FOV is about 1x1 arcmin.
Your vncviewer window will look like this
snapshot.
To analyze the data with Sensoft or with wfs
(software by Deb Woods and John Roll), you need one reference image, star
images and bias frames (imcombine a set). Subtract the imcombined bias
from the reference and star with iraf. Run Sensoft on baselap (laptop)
using the Puntino dongle. In Sensoft, click on "SH" to bring up the
directories menu and there, select the reference and mirror image, then
click on "ANALYSIS" to get a prescription.