Created: 07/29/05 by EF Updated: 04/27/17 by EF
Keplercam is a single-chip CCD camera with a Fairchild CCD 486 detector, built at CfA by John Geary, Steve Amato and Andy Szentgyorgyi with Dave Latham as PI. First-light took place about 9 pm on 27 July 2005 with E. Falco, T. Groner and A. Szentgyorgyi observing once monsoon activity cleared. Starting in 09/05, Keplercam replaced Minicam (in use 09/04-08/05), which in turn had replaced 4Shooter (in use 09/97-08/04). The quality of the images was good throughout the chip, although the seeing was poor as expected, around 3 arcsec. The appropriate camera axis is within 0.4 degrees from N-S, yielding images with N (E) at the top (left).
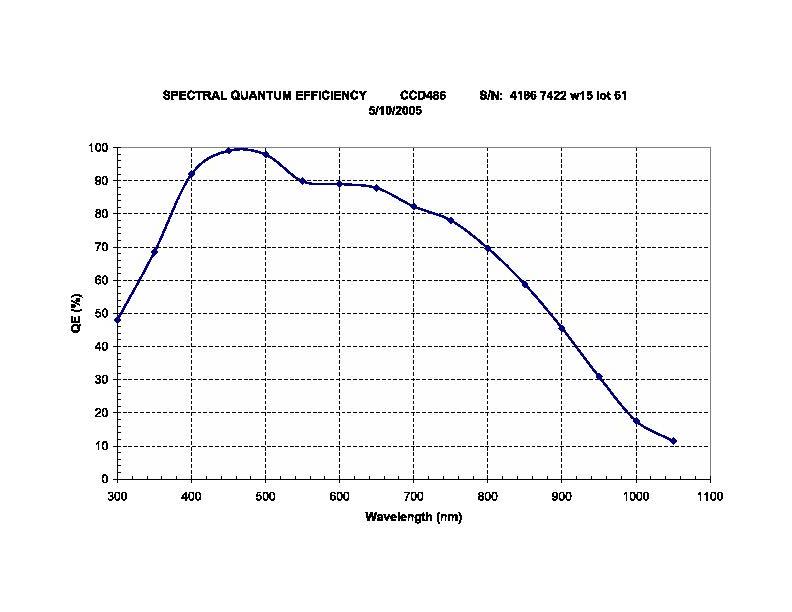
The full readout format is 4096x4096 pixels. The chip saturates at about 65,000 counts per pixel in the default 2x2 binning mode. A representative QE estimate (when warm) is shown here:
Here are estimates of the gain and readout noise calculated with mscfindgain:
   BIN x2 [200:800,200:800]       BIN x1 [200:1600,200:1600]
---------------------------       --------------------------
IM1:                              IM1:
  Gain       =  4.47 e-/ADU       Gain       =  4.87 e-/ADU
  Read noise =  6.51 e-	          Read noise = 14.95 e-
IM2:				  IM2:
  Gain       =  4.45 e-/ADU       Gain       =  4.61 e-/ADU
  Read noise =  7.18 e-	          Read noise = 13.50 e-
IM3:				  IM3:
  Gain       =  4.64 e-/ADU       Gain       =  4.88 e-/ADU
  Read noise =  7.40 e-	          Read noise = 15.17 e-
IM4:				  IM4:
  Gain       =  3.88 e-/ADU       Gain       =  4.05 e-/ADU
  Read noise =  7.86 e-	          Read noise = 15.15 electrons
Data are stored in /kep/yyyy.mmdd, where yyyy is the year, mm the month and dd the day. The format is 4 fits extensions. The data files are about 9 Mb for 2x2 binning. The data are automatically archived to Cambridge on TDC machines after each night.
#   Keplercam CHIP GEOMETRY
#
#            North
#    +---------++---------+
#    |         ||         |
#    |         ||         |
#    |  amp 2  ||  amp 1  |
#    |         ||         |
#    |         ||         |
#    +--------------------+
#    |         ||         |
#    |         ||         | West
#    |  amp 4  ||  amp 3  |
#    |         ||         |
#    |         ||         |
#    +---------++---------+
#    >                    <  (Iraf 0,0 and increasing column directions)
#
To offset to the center of the various amplifiers after centering a star at the center of the guide monitor, use these values:
+345 -345  # amp1
-345 -345  # amp2
+345 +345  # amp3
-345 +345  # amp4
Here are the relative efficiencies between amps, in the r band:
 Amp Amp N/Amp 1
  1  1
  2  1.03
  3  0.97
  4  1.18
Suggested dome-flat exposure times are:
B 60s
V 20
R  7
g 15
r  9
i  7
z 10
You should not take U or u dome flats - they will not work well. Use multiple either twilight or dark sky flats. We recommend the kdotwilight script for U or u band flats (or any other filter of your choice).
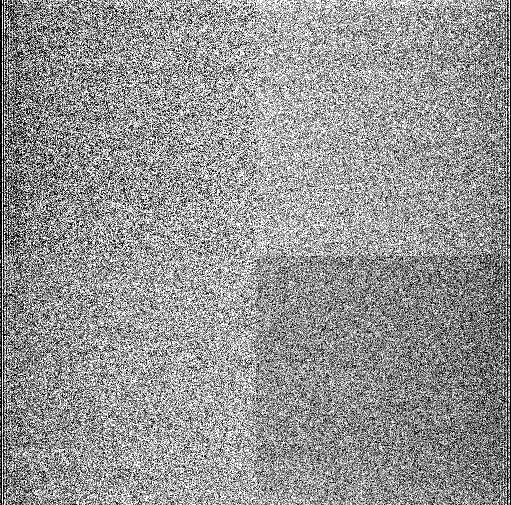
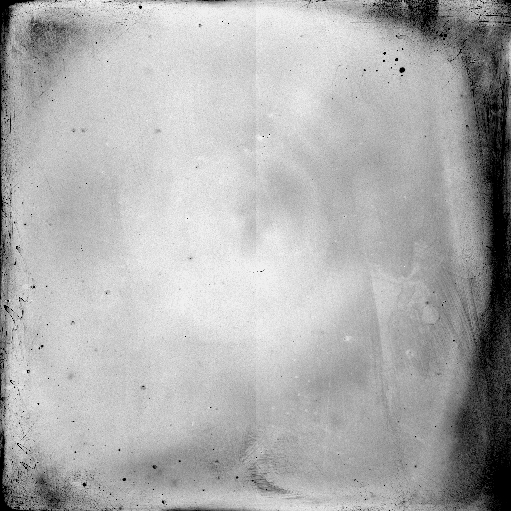
Here is an example of a bias (bin x2).
Here is an example of a B dome flat (bin x2, ~10000 ADU/pix).
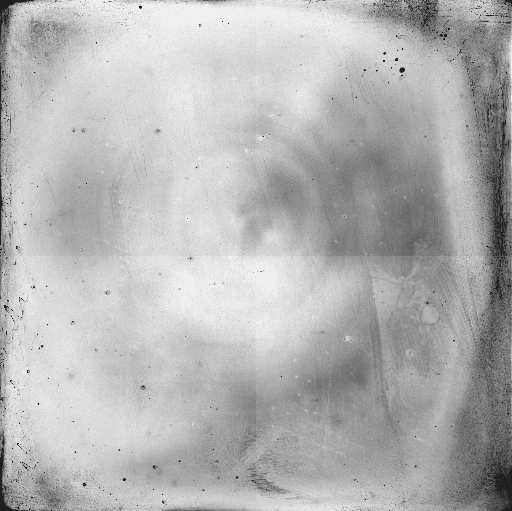
Here is an example of a V dome flat (bin x2, ~10000 ADU/pix).
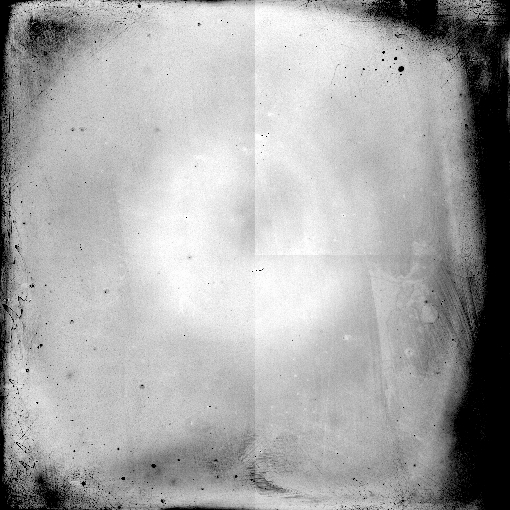
Here is an example of an r dome flat (bin x2, ~10000 ADU/pix).
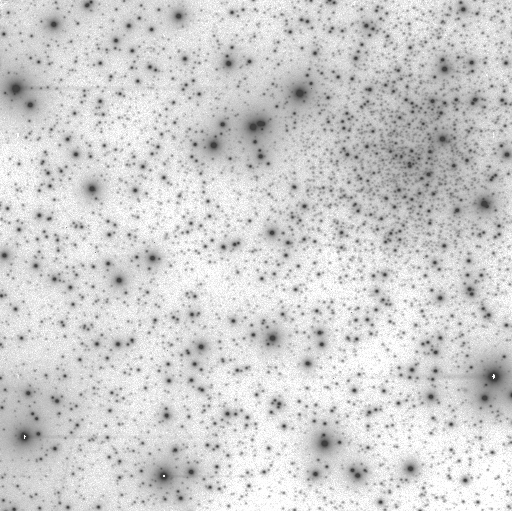
Here is an example of a flattened r exposure (bin x2) of NGC6791
I estimated the linearity of Keplercam from
a series of binx2
R dome flat exposures in quick succession, with exposure times
between 0.1 sec and 64 sec, beyond which the chip starts to saturate.
I used the lamp current of 6.2A that was being used for Kepler flats.
I corrected all the exposures for bias using the overscans.
I extracted 500x500-pixel sections for each
amplifier and calculated the median as an estimate
of counts per unit time and pixel. In each case, the median differed
from the mean by negligible amounts, which indicates
that there was an insignificant number of
bad pixels in each section. Choosing different sections of
the same size for each amplifier yielded the same results within about 1%,
except for exposures shorter than about 5 sec (see below).
I plotted the medians as a function of exposure time. First,
to normalize the curves, I fitted straight lines:
f = a0 + a1*t,
where f is the predicted value, a0 and a1 the
fitted intercept and slope, and
t the exposure time. I fitted only within the
range 5-55 sec, where linearity
is best (see the plot).
I subtracted each intercept from the counts C (ADU) and divided
the result by the slope and by the exposure time,
p = (C - a0)/t/a1,
so if C=f, p=1. Here is the plot of p vs. t:
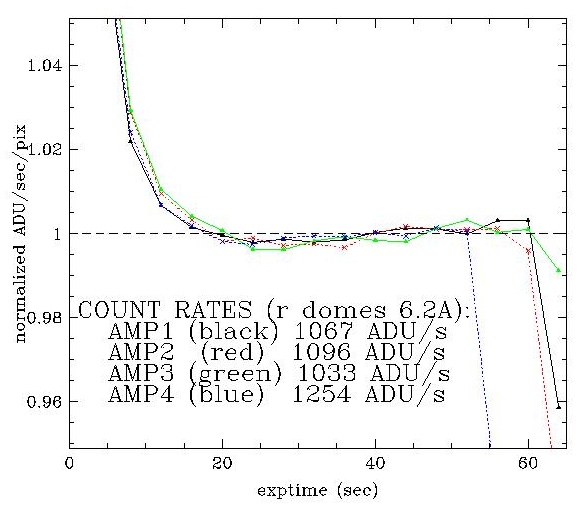
The results show that amp 4 has somewhat worse linearity than the others. For exposures shorter than about 5 sec, the shutter vignetting yields variations that appear as non-linearity at greater than 5% levels. Flats should never be exposed for less than 5 sec. See Mark Everett's description of shutter vignetting effects from his experiments of June 2008.
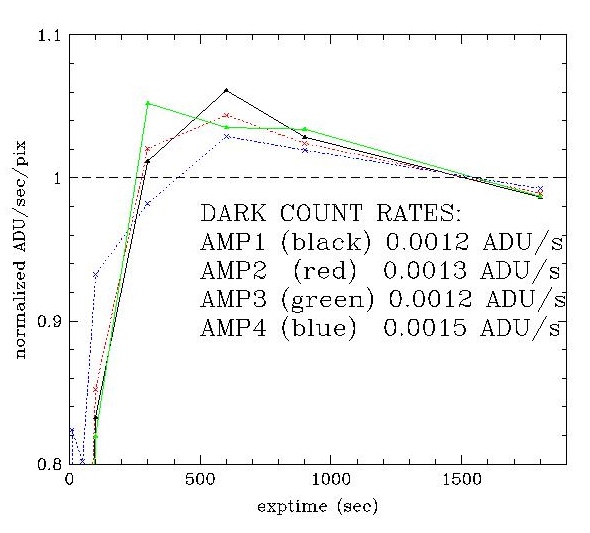
I estimated the dark-current characteristics of Keplercam from
a series of
dark exposures in quick succession, with exposure times
between 1 sec and 1800 sec.
I extracted 500x500-pixel sections for each
amplifier and calculated the median as above for the linearity
calculations.
I plotted the medians as a function of exposure time. As for
the flats, to normalize the curves, I fitted straight lines:
f = a0 + a1*t,
where f is the predicted value, a0 and a1 the
fitted intercept and slope, and
t the exposure time. I fitted only within the
range 10-1800 sec.
I subtracted each intercept from the counts C (ADU) and divided
the result by the slope and by the exposure time,
p = (C - a0)/t/a1,
so if C=f, p=1. Here is the plot of p vs. t: