Created: 09/16/04 by TG Updated: 01/14/05 by EF
Minicam is a 2-chip CCD camera, built at CfA by a team with Brian McLeod as PI. It became Megacam, with 36 CCDs. The chips are thinned, backside-illuminated Marconi (ex-EEV) CCDs, with full readout format of 2248x4640 pixels. The QEs of most of the chips are shown here. Each pixel is 13.5 microns in size, corresponding to an estimated 0.300 arcsec (unbinned) on the sky. Each chip is read out by 2 amplifiers that add a prescan and an overscan of 50 unbinned pixels each, on either side of the illuminated pixels, stored along the long dimension of each FITS extension. The two CCDs are mounted next to each other, with a gap between them. The WCS in the FITS headers is enabled, and takes account of the gap for all binnings. The gap is reported to be 1mm in the MMT's Megacam description. Measurements of 3 stars in an exposure of sn2004dt on 09/23/04 in amps 2 and 3 yield a gap of 23.1 arcsec, which corresponds to 1.04 mm, very close to the value reported in the MMT link. The field of each CCD is approximately 10.2x23.1 arcmin, for an effective science field of 20.4x23.1 arcmin (excluding the gap). Each amplifier is read out into a separate FITS extension in each output image. The readout time for the default 2x2 binning is about 10 sec.
When Minicam was at the MMT, the gain was "high" (in ADU/e-), but the gain is "low" at the 1.2m. Here are estimates of the gain and readout noise (using 2x binned r flats, one estimate for each amplifier):
mscfindgain 0619.FLAT 0620.FLAT 0628.BIAS 0629.BIAS sect="[200:400,400:600]"
  IM1:                          IM2:
  Gain       =  5.60 e-/ADU     Gain       =  5.93 e-/ADU
  Read noise =  7.65 e-	        Read noise =  7.97 e-
  IM3:                          IM4:
  Gain       =  6.80 e-/ADU	Gain       =  6.73 e-/ADU
  Read noise =  6.62 e-		Read noise =  7.14 e-
For comparison, here are gain and readout noise estimates for MMT data. On 10/07/04, Brian McLeod helped us investigate using "high" gain and equalizing the gains for the two CCDs. We concluded that we cannot do the latter via software given the hardware and its wiring, and that "low" gain is the optimal setting.
Data are stored in /mini/yyyy.mmdd, where yyyy is the year, mm the month and dd the day. The format is fits extensions. The data files are of course large (about 10 Mby for 2x2 binning). The /mini directory is large enough for several nights worth of data. You may need to clean out the directories for very long runs. On flwo48, we have DLT7000 and DAT4 tape drives with capacities of at least 20Gby. If possible, clean out all of your directories at the end of your run. The data are automatically archived to Cambridge on TDC machines after each night.
#   Minicam CHIP GEOMETRY
#
#            North
#    +----+----++----+----+
#    |    .    ||    .    |
#    |    .    ||    .    |
#    |    .    ||    .    |
#    |amp .amp ||amp .amp |
#    | 1  . 2  || 3  . 4  | West
#    |    .    ||    .    |
#    |    .    ||    .    |
#    |    .    ||    .    |
#    +----+----++----+----+
#    >         <>         <  (Iraf 0,0 and increasing column directions)
#
To offset to the center of the various amplifiers after centering a star at the center of the guide monitor, use these values:
-480 0  # amp1
-170 0  # amp2
+170 0  # amp3
+480 0  # amp4
Here are the relative efficiencies between chips/amps, in the r band:
Chip  Amp Chip N/Chip 1
1      1  1
1      2  0.97
2      3  0.84
2      4  0.84
Suggested dome-flat exposure times are:
B 60s
V 25
g 25
r 15
i 12
z 11
As for 4shooter, do not take U or u dome flats - they will not work. Use either twilight or dark sky flats. The cross-hatch pattern in the U flats (and to a lesser degree up to g, see below) arises from real QE variation on the CCD. As per B. McLeod, they are due to the laser annealing step of the thinning process. We recommend the mdotwilight script for U or u band flats (or any other filter of your choice).
Here are bin x2 dark sky rates, estimated for Oct 03, 2004.
g   4.1 ADU/s
r   3.9
i   3.1
z   2.7
Here is an example of a U sky flat (bin x2, ~13500 ADU/pix in amp1). We show here the result of flatcom (mscred package in iraf) using a sequence of 13 well-exposed twilight images by M. Hicken.
Here is an example of a g dome flat (bin x2, ~9000 ADU/pix in amp1).
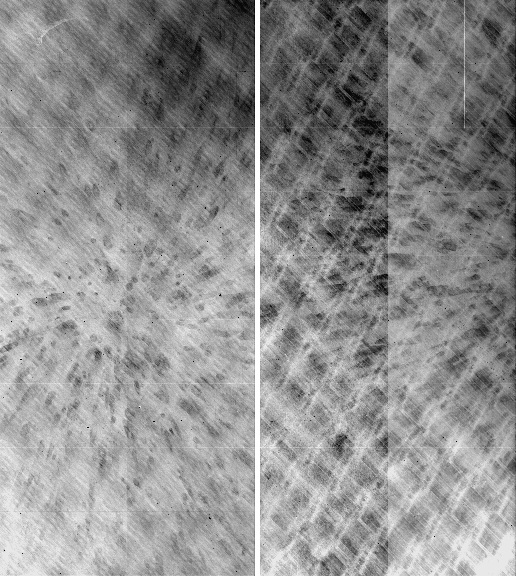
Here is an example of an r dome flat (bin x2, ~8000 ADU/pix in amp 1).
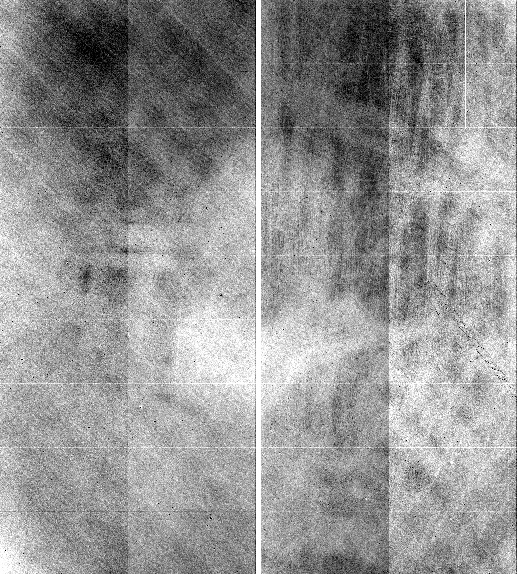
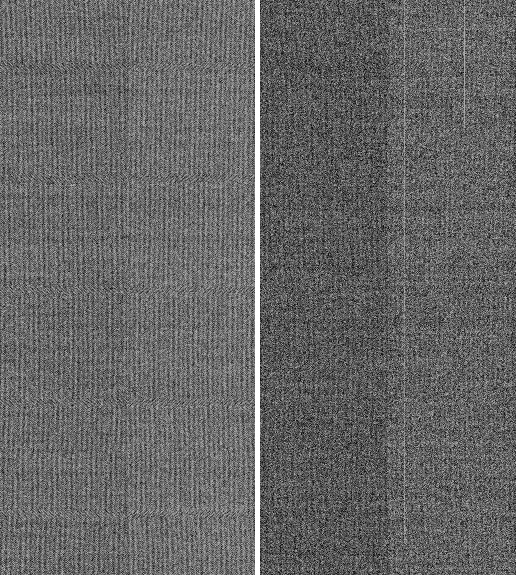
Example of an r dome flat (bin x2, ~10500 ADU/pix in amp 1) showing the effect of contamination.
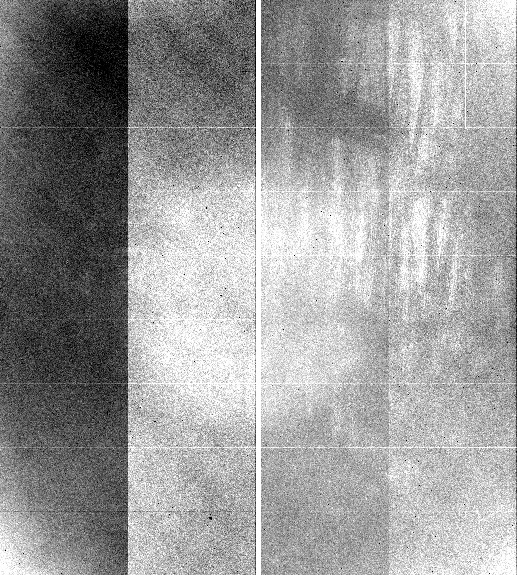
Here is an example of a bias (bin x2).
Mark Everett determined that sky exposure times are nearly equivalent to the 4shooter exposure times.
I (EF) tried to verify Mark's linearity estimates
estimates
for Minicam.
On 09/22/04,
I took 27 r dome flat exposures in quick succession, with exposure times
between 0.1 sec and 35 sec, beyond which the chips start to saturate.
I used the lamp current of 6.2A that was being used for Kepler flats.
I corrected all the exposures for bias using the overscans.
I extracted 300x700-pixel sections for each
amplifier and calculated the median as an estimate
of counts per unit time and pixel. In each case, the median differed
from the mean by negligible amounts, which indicates
that there was an insignificant number of
bad pixels in each section. Choosing different sections of
the same size for each amplifier yielded the same results within about 1%,
except for exposures shorter than about 5 sec (see below).
I plotted the medians as a function of exposure time. First,
to normalize the curves, I fitted straight lines:
f = a0 + a1*t,
where f is the predicted value, a0 and a1 the
fitted intercept and slope, and
t the exposure time. I fitted only within the
range 5-25 sec, where linearity
is best (see the plot).
I subtracted each intercept from the counts C (ADU) and divided
the result by the slope and by the exposure time,
p = (C - a0)/t/a1,
so if C=f, p=1. Here is the plot of p vs. t:
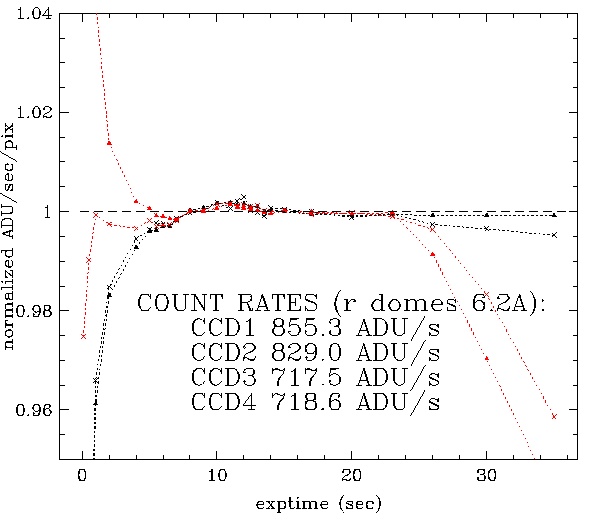
In this plot, the East chip is black, West red. Solid triangles (crosses) correspond to amplifier 1 (2) for each chip. The results show that the East chip has better linearity than the West chip. The East (West) chip starts to deviate from linearity at about 19000 ADU (17000 ADU). The East (West) chip deviates by less than 0.5% (5%) just before saturation. For exposures shorter than about 5 sec, the shutter vignetting yields variations that appear as non-linearity. Flats should never be exposed for less than 5 sec. In conclusion, I reproduce most of the gross features that Mark saw, but not some of his bumps and spikes.
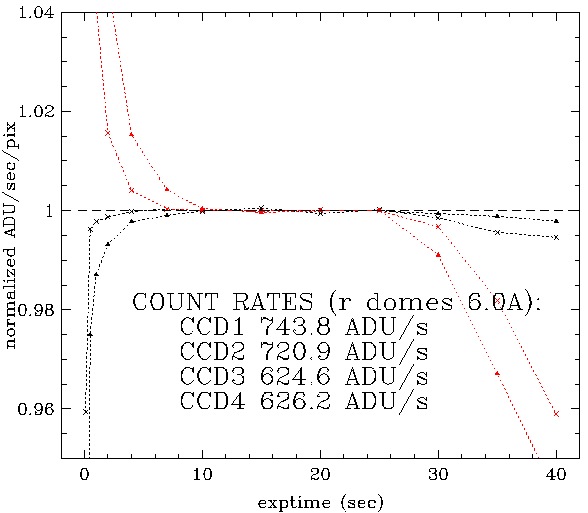
On 09/29/04 I obtained a new set of flats, repeating each exposure
5 times, applying overscan corrections
and calculating a median-combined image for each exposure. I used
the same method as before to characterize the linearity.
There were 2 changes this time:
I also tested the stability of flats taken in r for Kepler on 09/21, 22 and 23. I added more tests for 10/02, 10/03 and 10/05, after the flat lamp current was set to 6.0A. I used the same image sections as above and plotted the bias-corrected median values. I normalized these by an average for all 10 available exposures (all 12 sec). I chose this average for the exposures of 09/22, so all curves are normalized equally and plotted with the same scale, relative to that night. In the plot below, at the top are 09/22 (black) and 09/23 (red), and at the bottom 09/21. At the top are also 10/02 (blue), 10/03 (green) and 10/05 (cyan).
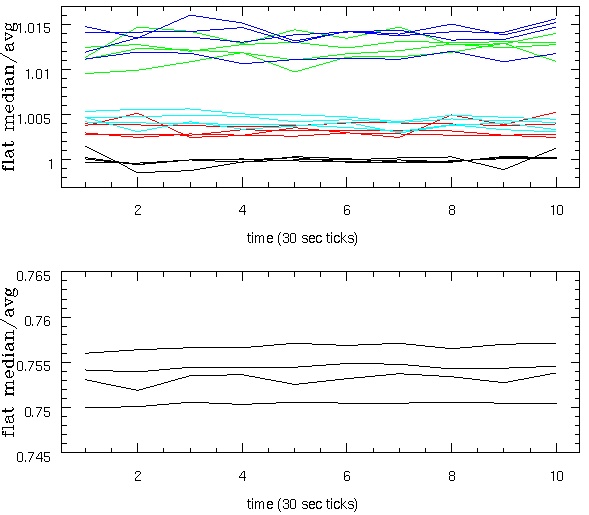
In September 2004 and especially during the night of 09/21/04, we were having a persistent noise problem with the CCDs. The problem went beyond the obvious need for controlling the temperature of the CCDs, which was taken care of early on. Brian McLeod helped us track down the persistent problem. His email put it best:
This evening (09/21) Wayne, Ted and I tracked down the noise problem
that Minicam has been having.  It turned out to be condensation in the
hermetic connector.  Apparently the hermetic connector gets colder
than the rest of the dewar case.  After getting it dried out, the
noise went away.  This may well explain the flaky temperature
measurements.  Whether it explains the variable gain that has been
seen in Channel 2 remains to be determined.  We drilled a hole in the
bottom plate of the preamp housing so that we could hook up dry air
flowing through that box.  Hopefully that will be enough to keep it
dry. From the amount of corrosion in the connector housing it seems
quite possible that the problem existed at the MMT well.
The lower count levels and the larger spread among different amplifiers for 09/21 were related to the condensation, which appears to be under control now.